
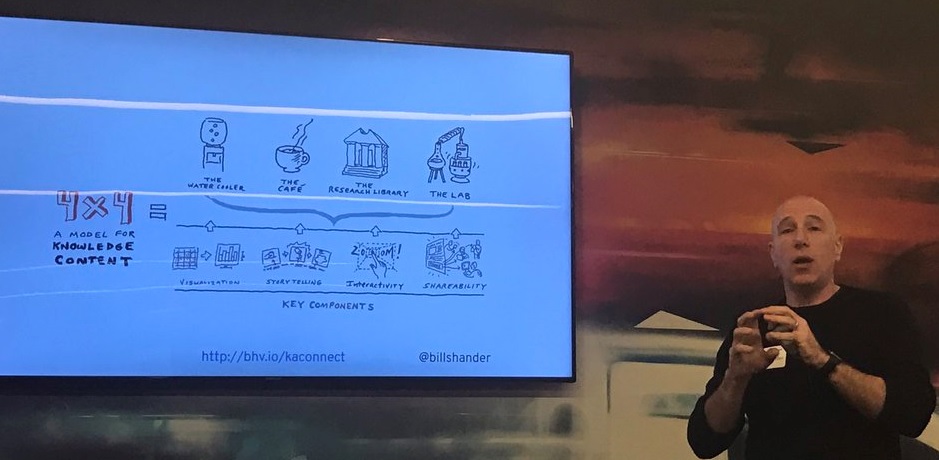
On April 19th, data visualization took center stage at a fast-paced, interactive presentation led by Bill Shander. In a marketing world where data and imagery are two of the most significant factors, Bill showed rather than told the importance of science, emotion, and visual techniques. His hands-on group exercises then helped us understand how to tell a story through data visualization.
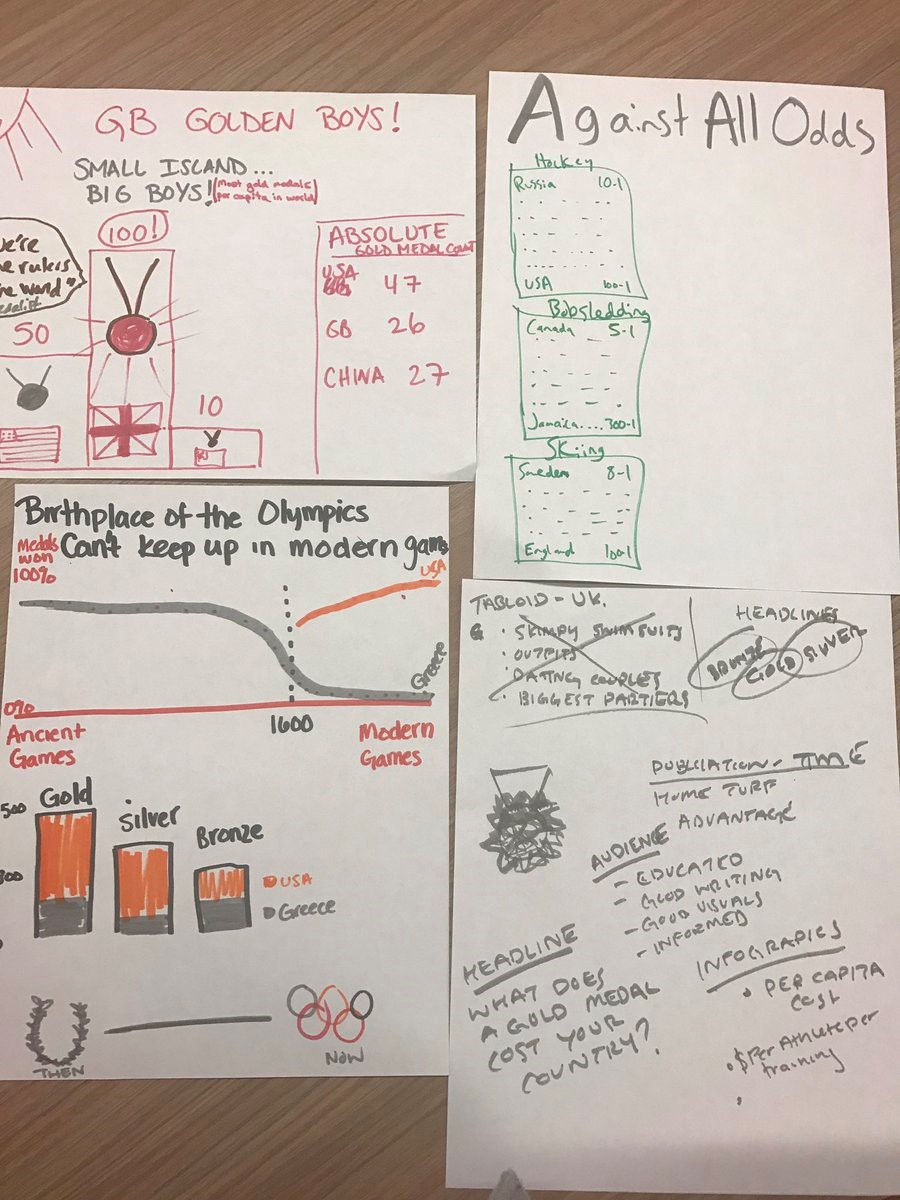
The heavily-attended event was held at Rapid7’s facilities in downtown Boston and Bill noted it was “insanely fast” given he offers full-day workshops on the same material! The audience gleaned the following insights, appropriately conveyed in charts, graphs, and other visual forms. Especially lively were the individual and group exercises on drawing money in five seconds, creating a  face from a squiggle, and developing an infographic from a cluster of data about Olympic medals.
- The number one challenge we face as communicators is the amount of data and information consumers receive on a daily basis.
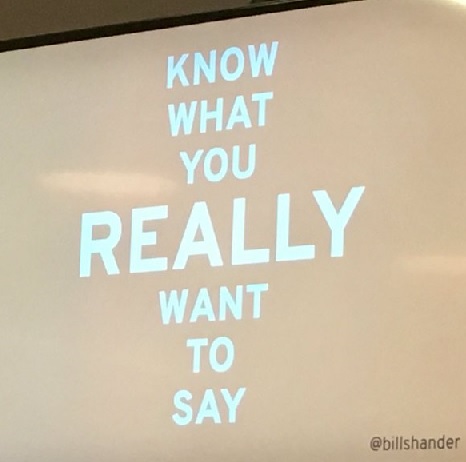
- Effective data visualization requires really knowing what you want to say.
- “Half of your brain is dedicated to visual processing. We are all visual learners first.”
- Visuals used in content result in 10x retention compared to content without visuals.
- Visualization, interactivity, storytelling and shareability are crucial elements of effective marketing.
 Use simple, outlining techniques to turn data into a story.
- Sketches help data analysts map out and outline their data into a story.
- Data visualization is all about pre-attentive processing.
- More data is generated in two days than had previously existed from the dawn of civilization to 2003, per Eric Schmidt.
- “In design, less is more” and simple beats complex.
- “Less ink is less to distract.”
- Per Milto
 n Glaser, “drawing is thinking.”
 - Visualization is almost always best – unless you are trying to sway people with opposing viewpoints, who think you are trying to trick them.
- Headlines are critical in your visual presentations.
- You can tell almost any story depending how you interpret and present the data.
AMA Boston would like to thank Bill, the crowd that enthusiastically participated in the many group exercises, and Rapid7 for the use of their impressive space. We hope you can join us for one of our many upcoming in-person events and webinars!